Overview |
 Comments (0) |
 Ratings (0) |
 Download |

|
||||||||||||||||||||
|
Search
Software
Advertisements!
Free-downloads
|
Options for ecGraph
Advertisement
ecGraph
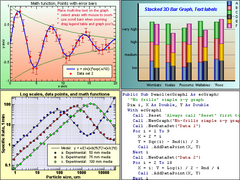
 ecGraph is a powerful graphing ActiveX control that you can drop into your Visual Basic programs to create graphs in a huge range of styles. Great for scientific or technical graphs. You can get a graph up and running with just a few lines of code, and can manipulate the graph layout at runtime from your programs.
* Easily create scientific or engineering graphs within your VB applications * Multiple graphs per page * Click and drag to move or resize graphs on the page * Zoom and scroll areas of the graphs * Multiple x- and y-axes per graph * Log or linear scales on axes * Plot data points, bars, text * Plot continuous math functions like y = sin(x)*exp(-x/10) * Plot data points against math functions, with vertical or horizontal optional error bars * Configurable grid lines, tick marks, borders, backgrounds * Legend tables, reverse axes, show/hide labels, transparent backgrounds * Demo projects supplied to show how all the features work * Project1 - simple viewer to load and display the demo graphs and the VB code used to generate them. * Project 2 - comprehensive graph editing program, loads the demo graphs and lets you edit them on screen * Hundreds of other features Advertisement
|
|||||||||||||||||||