Overview |
 Comments (0) |
 Ratings (0) |
 Download |

|
||||||||||||||||||||
|
Search
Software
Advertisements!
Free-downloads
|
Options for VIGraph
Advertisement
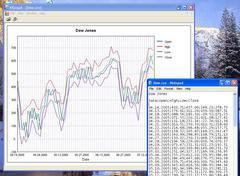
VIGraph
 It draws a diagramms from your txt-data files.
 It scales your diagramms automatically or manually. Simply make a txt or csv (ASCII) file like that: Dow Jones Date; Open; High; Low; Close 4.14.2005; 10403.71; 10457.06; 10248.23; 10278.75 4.15.2005; 10276.61; 10311.26; 10059.36; 10087.51 4.18.2005; 10088.54; 10183.50; 9961.52; 10071.25 4.19.2005; 10071.55; 10220.21; 10021.08; 10127.41 4.20.2005; 10131.18; 10232.34; 9978.74; 10012.36 Run VIGraph and open that file. You will get a diagramm with 4 colored lines (for Open; High; Low; Close). The header of diagramm will be 'Dow Jones' and the horizontal axe below will be 'Date'. You can open as much txt-files as you need simultaneously. Columns in the txt-files can be divided by commas, tabulators or semicolons. Call a parameters dialog and define what to show in diagramm.. Please do not use a comma for digital group separation ( 10403.71 - OK, 10,403.71 - not OK). Use point as a decimals separator (123.45 - OK, 123,45 - not OK). Look for examples of txt-files in 'Sample Data' directory (General Electric.txt etc). For registration run VIGraph and enter User Name and Serial Number in Menu Help / Registration Advertisement
|
|||||||||||||||||||